• Hello Fabrik Community

    Fabrik is now in the hands of the development team that brought you Fabrik for Joomla 4. We have recently transitioned the Fabrik site over to a new server and are busy trying to clean it up. We have upgraded the site to Joomla 4 and are running the latest version of Fabrik 4. We have also upgraded the Xenforo forum software to the latest version. Many of the widgets you might have been used to on the forum are no longer operational, many abandoned by the developers. We hope to bring back some of the important ones as we have time.

    Exciting times to be sure.

    The Fabrik 4.0 Official release is now available. In addition, the Fabrik codebase is now available in a public repository. See the notices about these in the announcements section

    We wish to shout out a very big Thank You to all of you who have made donations. They have really helped. But we can always use more...wink..wink..

    Also a big Thank You to those of you who have been assisting others in the forum. This takes a very big burden off of us as we work on bugs, the website and the future of Fabrik.

NV3D Chart

jmbarra78

Member
Hi again after two years.

I'm working in a new fabrik project and I need to show charts. I used Fusion Charts but I don't like very much because it uses flash. I would like use NV3D but I don't know how to do some things:

1 Can I show line graphs? For example: Temperature and humidity in the Y axis and time on X axis

2 Can I show pre-filtered list data in charts?

3 Can the user to filter on the chart? For example: Show data between two dates.

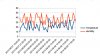
attached a sample chart

Regards!
 

Attachments

  • chart.png
    chart.png
    46.7 KB · Views: 382
Hi,

The nvd3 viz is very much "work in progress". We are casting around looking for the best replacement for Fusion Charts, to do charting in either pure JS, or HTML5. Rob built the nvd3 viz more or less as a "proof of concept", and to be honest I don't know much about how to drive it.

In particular, I don't know if it supports multi line, which is what I think you are wanting.

How far have you gotten with it? Have you actually tried creating a line chart yet?

Bottom line, this will be a learning experience for both of us. :)

-- hugh
 
Hi!
I've tried creating a line chart without success, points are shown only vertically
I've noticed that scripts can be used, but I could't look yet...


Attach screenshots with chart and options
 

Attachments

  • nv3d_line_chart.png
    nv3d_line_chart.png
    23.5 KB · Views: 365
  • nv4d_line_chart_options.png
    nv4d_line_chart_options.png
    13.3 KB · Views: 363
  • nv5d_line_chart_options2.png
    nv5d_line_chart_options2.png
    14.7 KB · Views: 339
  • nv5d_line_chart_options3.png
    nv5d_line_chart_options3.png
    13.9 KB · Views: 353
  • nv5d_line_chart_options4.png
    nv5d_line_chart_options4.png
    21.1 KB · Views: 347
Yeah, I did a quick test, and wound up with the same looking result.

I have a couple of folk starting to ask "awkward questions" about this viz, so I have to talk to Rob to see whether we are in a position to provide support for it, and continue development of it. As-is, it really is not ready for prime time yet, it's WiP (Work in Pogress), and we typically don't provide support for WiP stuff.

However, we do realize that the other two charting viz's really have / are reaching the end of their useful life. The google charts one is still useful for small, simple charts. But it quickly falls afoul of dataset limitations (I think they only allow 256 rows in the dataset), and the code has suffered bitrot over the years, as very few people use it, so it doesn't tend to get much love when we update core code that it relies on.

And the Fusion Charts one obviously relies on Flash, which is obviously not Mobile Friendly any more, since the Great Google Versus Adobe Pissing Wars Of Ought Eleven, that resulted in Android no longer supporting it. And also it relies on a version of Fusion Charts which they no longer distribute (although they don't mind us doing so, I've checked with them on that).

So it seems like it's time we either peed or got off the pot with regards to the nvd3 viz. But I'll need Rob to sign on for it, as I really am not familiar with the code, and at least to start with will need a fair amount of assists from him, until I can grok it in all fullness.

rob?

-- hugh
 
In the meantime, if you are in a hurry, I managed to add the pie charts and the line charts to the basic bar chart, the only graph currently available in the plugin. You can see an example here: pie chart and line chart.
Pie chart works fine but the line chart is much more complex and may need some custom adjustment, so there is no garantee it will fit your needs.
But I'm available for any custom work, also if you want to implement other charts.
 
Hi! Thanks for your answers, I've seen the line chart and it's enough for me but I need to filter on the chart (by date range). How could display a chart like this?

In the meantime I'll use Fusion Chart...

Regards!
 
As far as I can tell, as JFQ said, that would need some custom coding, as the way the viz is currently built, it's using "raw" tables (as a selection of connection + table name), NOT "Fabrik Lists", so built in filtering isn't available. There's another thread going on discussing this, somewhere.

http://fabrikar.com/forums/index.php?threads/visualisation-filter.39382/#post-197849

To be honest, the bottom line is ... well, the bottom line. Plugins like this tend to get developed on an "as funded" basis. Simpler plugins, like validations, or (some) element types, we'll just build from scratch to release in one go, on our time. But something as large and complex as a charting viz tends to get done gradually, as we get people prepared to fund it for specific projects. Which is how the nvd3 viz as-is came in to being, as someone needed a non-Flash solution for some specific charting work, and Rob decided to experiment with nvd3 for it. The result was good enough to add to our repo as a "work in progress", but since then we haven't had anyone bite on helping to fund any further development of it.

We just simply don't have the time to take a week or two out and completely build something like this, as we have to spend most of our time doing work that pays our rents and puts food on the table. So what tends to happen is someone will have a pressing need to (say) have a multiple line chart filterable by date. We'll agree to do it as a custom project, but only charge some percentage of our usual rates, if we can use the resulting code in the viz itself, so it benefits Fabrik and all our users. ;)

-- hugh
 
Hi,

I know this chart plugin is very basic (soo sad...), but i found a little bug in the script. It doesn't grab the width from backend:
nvd3_chart/tmpl/default/default.php line 27
old
PHP:
<svg style="height:<?php echo $this->params->get('height', 350); ?>px;width="<?php $this->params->get('width', 350)?>px"></svg>
My change to this didn't make any difference, only in page source
PHP:
    <svg style="height:<?php echo $this->params->get('height', 350); ?>px;width=<?php echo $this->params->get('width', 350)?>px"></svg>

My main interest was to get some HTML5 charts working.
I like the nvd3 Chart very much, also it will work together with Fabrik in the future. For now it would very helpful to understand, how the script option works on nvd3 plugin. I have managed to get a chart with pie.html and json file, but this doesn't work, when I grab the html file as script in backend.

I really like to support this project and willing to pay for custom coding. I guess there are more people who need this HTML5 charts.

Anyhow, for now I use the component PLOTALOT to generate some charts. This is very close to fabrik with sql queries.

Cheers,
Bianka
 
We do plan to do more work on this as we get time / funding. Charting is a very complex beast, so we're basically building on this plugin as and when we can, to meet individual project requirements, which will incrementally improve it.

Once we get the JED (and hence core of Fabrik 4) work we are currently doing out of the way (nearly there!), and can spend some more time on F3 issues, one or both of us would no doubt be able to work with you on achieving what you need.

Meanwhile, if you want to catch me on Skype, we haven't caught up for a while, I'd enjoy a chat anyway (bring you up to date on my back surgery, and all that!), and we can at least establish more fully what you need, and I can take a quick look at fixing any more minor issues.

-- hugh
 
We are in need of some funding.
More details.

Thank you.

Staff online

Members online

Back
Top