Visualizations - googlemap

Status
Not open for further replies.

bobwiz

New Member
A. Delighted with my lists/forms connected to separate database outside of joomla database - marvellous.
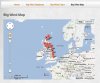
B. Pleased to bits with being able to add a lat-long field to my table that allows me to have a map element to each record - fantastic

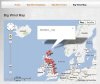
However now struggling with visualizations. Wanting to set up a single page map that shows locations of all my records rather than the above which shows a single location for a single record.
1. Tried to watch the tutorial on this (03-User Profiles/03-Map Visualization) - however this is for the wrong version of Fabrik, plus it seems corrupted as it goes into a loop about 60% through.
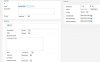
2. Looks like I can correctly set up a Visualization using googlemap option and correctly selecting my database and tables - however when I run this through a new menu item that picks up this visualization, I get the error below:-
"Notice: Undefined offset: 0 in /home/sites/<mysite.com>/public_html/plugins/fabrik_visualization/googlemap/models/googlemap.php on line 105 Fatal error: Call to a member function getFullName() on a non-object in /home/sites/<mysite.com>/public_html/plugins/fabrik_visualization/googlemap/models/googlemap.php on line 105". Anything obvious I'm doing wrong?
3. After getting this error, I find that a setting in my database list is now being ignored. The Navigation setting should limit the table to displaying 30 records at a time, but this now displays all records (900 of them) and no amount of playing around seems to be able to reset this back to what it was previously.
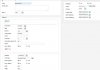
4. I note that when setting up the visualization, the access level being set is not 'sticky' - i.e. when I set 'restricted' level and save, it reverts to 'nobody' setting on the screen (not sure what it's actually set to).

Maybe it's time to get another github, or is it not as serious as that?

bobwiz
Joomla 1.7.1 / Build 403 / PHP 5.3 / MySQL 5.1 /Firefox
 
Updated build to latest - Visualisations still not working

Guys,
Now updated my system to latest build, but unable to get either a googlemap or a chart visualisation to work.

When I attempt a chart, I get a blank page - as reported above I wondered if the access level was the problem as I had entered a 'nobody' and another fault is that when saving the visualisation the access level gets changed - but it's not that.

OK I get a blank page. I am including a picture of my settings, and below am including the detail of the error I get from Firebug.

The data numbers in the error make sense to me, but don't know about the logic/code.

"NetworkError: 400 Bad Request - http://chart.apis.google.com/chart?chs=400x2000&chd=t:2,46,6.15,38,0.75,54,2,48,45,6,10.8,93,23,26,11.7,27.6,6.9,6.9,17.5,6.9,19.3,42,0.23,0.66,15.03,24,6,120,7,12,3.9,19.5,9.1,2,20.7,4.62,42.5,2.4,0.9,30,2,16,2.7,0.9,1.8,52.5,0.8,6.9,4,0.8,0.8,4.8,4.8,14.3,8,13.8,4.9,0.9,90,0.5,9.6,10,0.23,18,0.5,30.36,38,8.4,9,30,4.6,23,4.6,9.2,0.9,78.3,5,9,5,2.5,26,8,20,9,4.5,17.5,9.2,28.6,96.6,27.6,18.4,69,39,0.01,21,69,6.9,3.9,69,6&cht=bvs&chco=&chxt=x,y&chxl=0:|1|2|3|4|5|6|7|8|9|10|11|12|13|14|15|16|17|18|19|20|21|22|23|24|25|26|27|28|29|30|31|32|33|34|35|36|37|38|39|40|41|42|43|44|45|46|47|48|49|50|51|52|53|54|55|56|57|58|59|60|61|62|63|64|65|66|67|68|69|70|71|72|73|74|75|76|77|78|79|80|81|82|83|84|85|86|87|88|89|90|91|92|93|94|95|96|97|98|99|100|1:|0|120&chds=0,120"

Any assistance appreciated - thanks

bobwiz
Joomla 1.7.2 / Fabrik 3.0b / Firefox
 

Attachments

  • Chart.JPG
    Chart.JPG
    59 KB · Views: 211
for the google map - I guess you were trying to use the polyline feature? If so I can see that there was a bug in there which I have fixed @github.

For the chart I'd need to see all of the options you selected and if possible a url to the list that the chart is drawing its data from.

-Rob
 
I'm in a mess

Rob,
Many thanks for trying to help.
I was nearly at the stage of sending you an update when I made a complete mess of a github update - that's put me back several hours and just about reduced me to tears of frustration! I clearly haven't got the knack of an update as I'm having to go back to a fresh install and then manually replace each folder (at the lowest level).

The problem I had was after uploading the latest zip from github, I unpacked it on the remote site and starting dropping high level folders on top of existing folders but all that happened was I get a folder called components inside a folder called components etc

I don't think I can run a Linux command on my ISP webhost, so I guess it must be done manually. Is there a better tool (I'm using FTP Rush).

regards
bobwiz with tail between legs (temporarily)
 
i use an ftp client. (filezilla but i guess they all do the same thing).
extract the zip locally and then ftp up the files, it takes a while but there isn't anything too complicated, Im not sure how you got the recursive components/components thing!

Otherwise if you have eclipse installed you can run the build.xml file with ant and it will make an installable zip for you, which you can then install as a normal joomla extension

-Rob
 
Visualisation - googlemap

Rob,
First-up - thanks for helping with my github update process - I changed to filezilla and it works a treat :).

Second-up - I got the chart working by reducing the number of points - using Firebug I trapped an error from the googlemap api.

Finally - Googlemap still not working - I get a blank page and it throws a '500' error with no diagnostics available from Firebug. Yes, I'm trying to map a number of data points onto one map and whether correct or not am using the polyline feature - perhaps I need a polyppoint feature, so maybe I'm asking too much of this function?

I know the basic googlemap feature works as with help from Cheesegrits I have a field in my database that holds all the lat-long fields in fabric 'internal format'. When I call up a record from my database and enter the form, it displays a map at the foot of my field list that correctly interprets the above special format data to be a single point on the map (representing a single row of my database).

Question is, should I be able to call up a single map and plot multiple points automatically from the database?

Thanks
bobwiz
 
yes you should be able to call up a single map and plot multiple points automatically from the database using the map viz. I set up a test map using the polyline fetaure and spotted a couple of issues that i have fixed - could you try updating again and see if that works now?

thx
Rob
 
Good News / Bad News

Rob, Hi
Good News - my 'Big Map' page now works. I needed to set the polyline width to zero as I only wanted points but works good - see Big Wind Map attached.

Question - how do I populate the bubble with info from my database - can I insert some command here like {table__fieldname}. Any help appreciated.


Bad News - your fix appears to have killed the map that I had coming up in my form. I have a link in my LIST that calls up the FORM when clicked. The form had a number of fields showing including my 'map' element. I haven't changed any of my configs - just uploaded Build 66 - now my map field is empty - see attached.
I'm also getting the transitory message in Firebug (but this may be a poisson rouge!) "Reactivate to load window console" and a deprecated command message.

Regards
bobwiz
 

Attachments

  • Big Wind Map.JPG
    Big Wind Map.JPG
    54.9 KB · Views: 184
  • Form Map.JPG
    Form Map.JPG
    44 KB · Views: 191
I needed to set the polyline width to zero as I only wanted points but works good
In that case just not selecting a poly line element should be sufficient.

can I insert some command here like {table__fieldname}
yes that should work!

Bad News - your fix appears to have killed the map
Hmm darn can you double check with today's gitcode and ensuring you have cleared your browser cache? If its still not working I would need to see the page in order to debug the js (its working locally for me now, where as before yesterday the map wasn't loading for me!)

-Rob
 
Visualisation / Googlemap / Bubble

Rob,
Thanks for further work on this - feedback as below based on today's Build 82.


Quote:
I needed to set the polyline width to zero as I only wanted points but works good
In that case just not selecting a poly line element should be sufficient.
Yes - that works well - thanks.

Quote:
can I insert some command here like {table__fieldname}
yes that should work!
No, that does not work - am I trying something daft - see attachments ('Windfarm' is my table and 'mw' is an element).

PS to above: Another issue is the access level - see the setting attachment - it may or may not be working correctly but it is not reporting correctly. When I set to 'registered' and save, the display shows as 'nobody' (which I set up earlier).

Quote:
Bad News - your fix appears to have killed the map
Hmm darn can you double check with today's gitcode and ensuring you have cleared your browser cache? If its still not working I would need to see the page in order to debug the js (its working locally for me now, where as before yesterday the map wasn't loading for me!)
Great News - Back working again - so now have map showing in Form with single record and in Visulaization with multiple records.

regards
bobwiz
 

Attachments

  • Big_Wind_Map bubble.JPG
    Big_Wind_Map bubble.JPG
    63.1 KB · Views: 184
  • Big_Wind_Map settings.JPG
    Big_Wind_Map settings.JPG
    55.2 KB · Views: 175
Hard to tell from the image, but is that three underscores in your element name, or two? It looks like two, and in your previous message you used two in your example.

It needs to be three underscores, {table___element}. If in doubt, copy and paste the full name from the main Elements display.

-- hugh
 
Status
Not open for further replies.
We are in need of some funding.
More details.

Thank you.

Members online

No members online now.
Back
Top