
-
New Commercial Services Section
We have now opened a commercial services section here on the forum for registered users. If you have a Fabrik project that you wish to have someone work on for you, post it under Help Wanted. If you are an application developer and wish to earn some money helping others, post your details under Fabrik Application Developers.
Both of these are unmoderated. It will be up to both parties to work out the details and come to an agreement.
-
Joomla 5.1
For running J!5.1 you must https://fabrikar.com/forums/index.php?wiki/update-from-github/ or include the new file manually https://fabrikar.com/forums/index.php?threads/joomla-5-1-and-fabrik-cannot-find-files-error.54473/post-285151 See also Announcements
Google Maps visualization
- Views Views: 43,027
- Last updated Last updated:
-
Contents
The map plug-in lets you take data recorded by the google maps element plug-in (available as an extra download from fabrikar.com's download section) and plot them on a google map
NOTE: As of June 2016, Google require an API key to use google maps, which you can obtain (free) from Google, see https://developers.google.com/maps/documentation/javascript/get-api-key#key. Once you have your key, enter it in the Fabrik global Options, see https://fabrikar.com/forums/index.php?wiki/options/
There are several API keys, the one you need is the browser key.
Since 2019 Google requires additionally a billing account (credit card linked to your Google account). 200$/month are free (at time of writing 2020)
https://cloud.google.com/maps-platform/pricing/sheet
Add Multiple Lists to the visualization
Repeatable controls
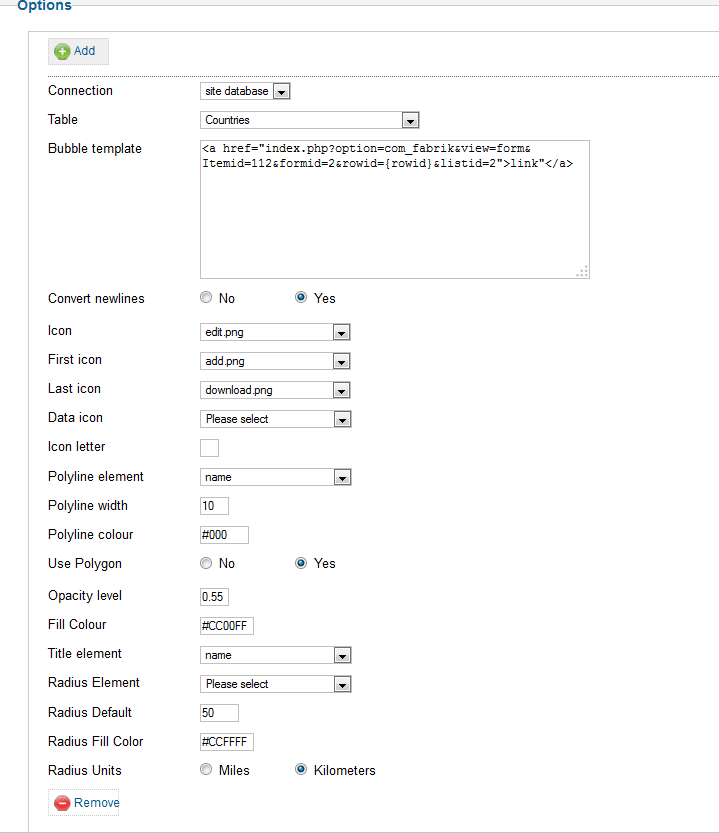
You can add and remove instances of the following controls by pressing the add and remove buttons:
- Connection - - Connect up some of your existing Fabrik tables to the map by selecting the Fabrik connection in which they will be found
- Table - The fabrik table whose data you want to display in the chart. Make sure that the map element is included in the list query when rendering a map, otherwise the map element data will not be displayed. (set "Include in list query" to "Yes")
- Bubble template - HTML template that defines the content of the bubble text that appears when you hover over the map's markers. Normal placeholders can be used, also the additional Placeholders:
- {fabrik_view} - formatted link to detail view
- {fabrik_view_url - URL to detail view
- {fabrik_edit} - formatted link to form view
- {fabrik_edit_url} - URL to form view
- {coords} - Comma separated coordinates.
- {coords:X} - like {coords}, but specify the number of decimal places to use, like {coords:5}
- {nav_url} URL to Google maps in navigation mode, eg. will open Maps app on Android with this location as the destination.
- for element Placeholders {table___element-name}: make sure your element has set "Include in list query"=yes (this is the default). If you want to display the formatted data the element needs additionally "Show in list"=yes or "Always render"=yes.
- Convert new lines - Covert new lines in the bubble template into <br /> tags
- Icon - Select an image from /media/com_fabrik/images to be used as the marker icon, if none selected then the standard google maps marker is used
- First icon - the image to use for the first record's marker
- Last icon - the image to use for the last record's marker
- Data icon - select an Image element from your table, the data from this element will be used as the marker icon. This setting will overwrite any setting you have selected in the Icon option
- Icon letter - Select a letter to be shown inside the standard google marker image
- Poly line element - If an element is selected then a poly line is drawn between each of the markers ordered by this element
- Polyline width - the width (in pixels) of the polyline.
- Polyline colour - the hex colour to use for the polyline e.g. #00ff00
- Use Polygon - Use a polygon instead of a polyline, means that the area inside the polygon will be filled
- Opacity level - A value between 0 and 1 for the polygon lines fill opacity. 0 = completely see through, 1 = completely opaque
- Fill Colour - Polygon fill colour -a RGB hex value
- Title element - If selected then the element's data will be shown as hover text when the mouse is moved over its map icon
- Radius Element - If you have enabled Use Radius in the Advanced Options, you may specify the element you use to store the radius, and display them as colour filled circles around each marker on the map.
- Radius Default - Value to use for radius default if Fabrik can't find a value to use
- Radius Fill Colour - A RGB Hex value for the radius' fill
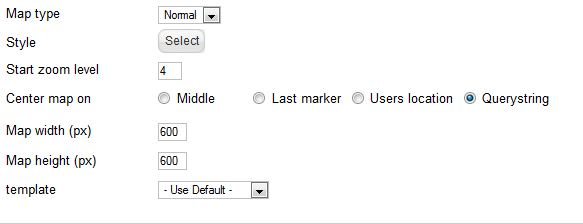
- Map Type - the map type to render you have
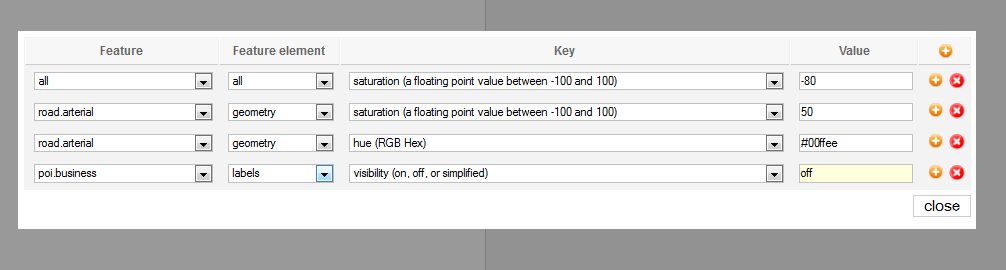
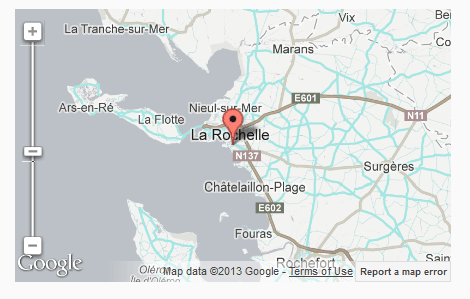
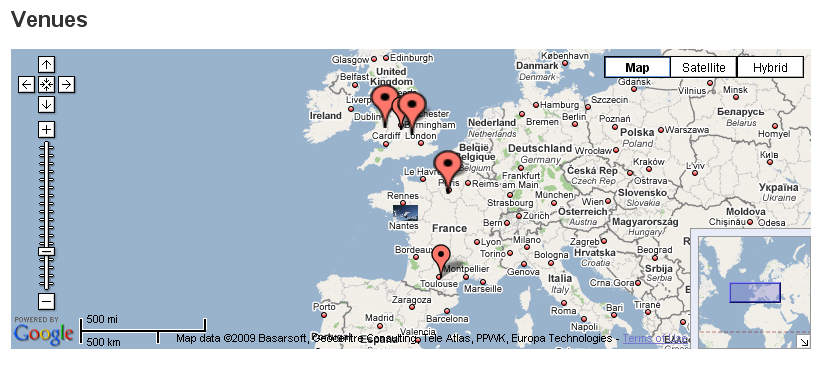
- Style - Define a custom style for the map
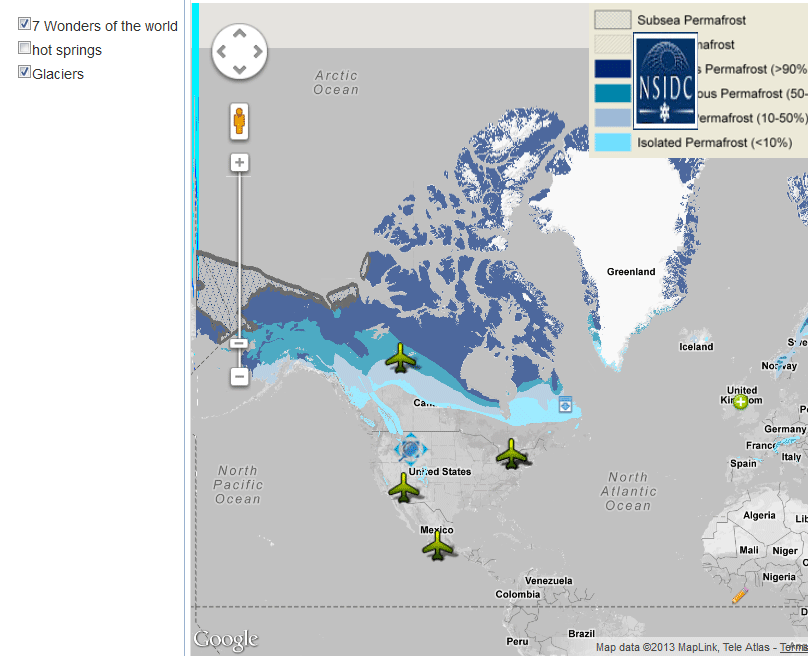
produces a map like this:
- Start Zoom Level - The start zoom level. Zoom levels between 0 (the lowest zoom level, in which the entire world can be seen on one map) to 21+ (down to individual buildings)
- Center map on - when the map first loads what should it center on?
- Middle - The middle of the markers
- Last marker - The last marker in the table (useful when time has an importance on your geo data)
- Users location - This option will attempt to locate the user via their browsers geolocation api. This is an opt-in choice by the user. If they choose not to reveal their current location then the map is centered on the middle of the markers.
- Querystring - If querystring is selected, you can provide three additional query string arguments on the URL to your viz using a custom link: ?latitude=xxx.xxx&longitude=xxxxxx.xxx&zoom=x"
- Map width (px) - Leave blank for the map to use it's container's full width
- Map height (px)
- Template - the template to render the map in, these can be found in components/com_fabrik/plugins/visualization/googlemap/views/googlemap/tmpl/
Controls
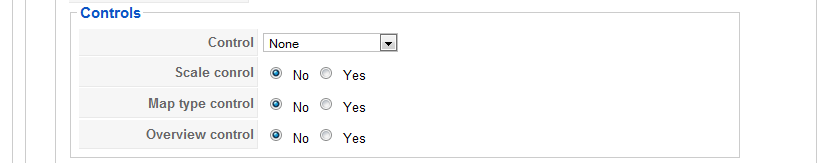
- Control - the size of control to show on the map
- Scale control - should the map contain a scale control - this shows the user at what scale the map is being render
- Map type control - should the map contain a map type control - this allows your users to switch between the different map types that google allows, e,g street map or terrain.
- Overview control - this control shows a zoomed out version of the map in a small in-line window.
Ajax Refresh
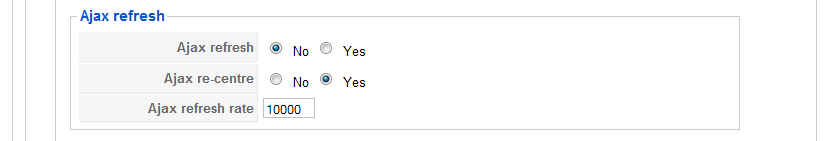
- Ajax Refresh - If yes selected then the map regularly polls the server to update its data.
- Ajax re-centre - If yes then the map re-centres itself after each ajax refresh.
- Ajax refresh rate - the time in milliseconds between each Ajax refresh
Clustering
When you start getting large numbers of icons on a map you will see Performance drop in the map. At this point you should consider clustering. Clustering Groups a series of markers into one marker, as you zoom into the map the cluster is split until eventually you see individual markers
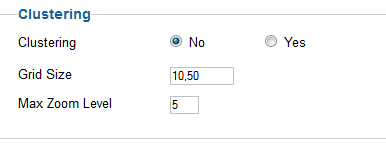
- Clustering - set clustering on or off
- Grid size - The grid size, in pixels, of each cluster. Default is 60. Larger sizes will increase speed
- Max zoom level - This is the maximum zoom level at which a cluster is displayed, before splitting into single markers.
Advanced
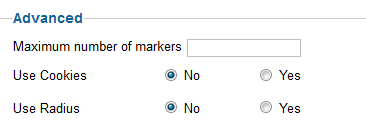
- Maximum number of markers - Limit the number of markers that can be shown on the map. If set to 0 or left blank then all markers are shown. If clustering is turned on then this is the maximum number of markers BEFORE the clustering is applied.
- Use cookies - if set to yes, then the maps current center and zoom level are stored in cookies, which means that when the user revisits the map its location and zoom level are the same as when the user left the page.
- Use Radius - If you use the Radius widget feature on your map Elements, or otherwise have radius data in your list, you can enable display of radius around each marker. Remember to select the main Radius Options above
Overlays
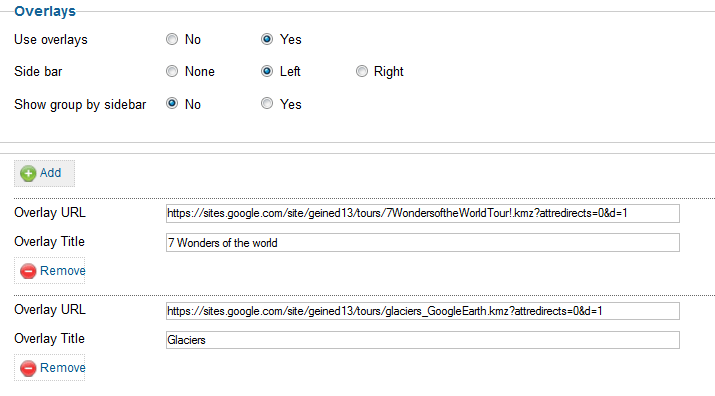
- Use overlays - Should the overlay section be enabled
- Side bar - location of the side bar that allows users to toggle on/off overlay
- Show group by sidebar - If your Lists have their group by option turned on, then selecting yes will add a list of the group headings into the sidebar. Clicking on these headings will filter the maps data to show only the records in the selected group.
- Overlay Eval - see section below, allows eval'ed code to generate the following overlay data(url, label, etc) with eval'ed code
- Add as many overlays as you like with:
- Overlay URL - a URL to the KML file you want to use for the overlay; the file must be on a public server, accessible by Google (so NOT a file on your localhost).
- Overlay Title - the title used to represent the overlay in the side bar.
- Preserve Viewport - should the map zoom to the overlay when selected
- Suppress Info Windows - should the map allow popups on the overlays
Overlay Eval
As well as specifying your overlays statically in the settings, you can generate them on the fly provide some PHP code which returns an array describing your overlays. The array your code returns needs to be an array of arrays, representing the four settings for each overlay - the url, label, preserve viewport and suppress infowindows. And they have to be named axactly ...
Code:
$myOverlays = array(

   'urls' => array(

      'http://example.com/path/to/file.kml',

      'http://example.com/path/to/another_file.kml'

   ),

   'labels' => array(

      'file one',

      'file two'

   ),

   'preserveViewports' => array(

      '1',

      '0'

   ),

   'supressInfoWindows' => array(

      '1',

      '0'

   )

);

return $myOverlay;
Obviously the usual reason for doing this on the fly would be to provide overlays which depend on the map markers being shown. We don't allow Placeholders in this code, but we do provide a data structure which describes the map markers being shown, and the list row data associated with that marker. The data is in $this->iconRowData[], one entry per marker, which is itself an array of two arrays, 'icon' and 'data'. The icon' array is our internal data structure describing the icon - lat, lon, template html, icon image path, etc. The 'data' array is the list's row data for that icon, keyed by full element name.
So, for example, if you wanted to have an overlay associated with every map marker, where you have two Elements in the row data, one for the overlay URL and one for the label ...
Code:
// init the return array, needs to have this structure

$myOverlays = array(

   'urls' => array(),

   'labels' => array(),

   'preserveViewports' => array(),

   'suppressInfoWindows' => array()

);


// loop through the marer data, assigning our element values to url and label

foreach ($this->iconRowData as $iconData) {

   $myOverlays['urls'][] = $iconData['data']['yourtable___overlayurl'];

   $myOverlays['labels'][] = $iconData['data']['yourtable___overlaylabel'];

   // even if you don't care about the next two, you still have to assign them

   $myOverlays['preserveViewports'][] = '1';

   $myOverlays['supressInfoWindows'][] = '0';

}


// return our array

return $myOverlays;
Example of overlays in use
Using Joomla plugin
Let's say you'd like to use the nice plugin extension called "Modal" from former NoNumber (https://www.regularlabs.com/extensions/modals) to open an article, an image or a video in a modal popup from a link inside the Bubble. You can even start to play a video inside a modal as soon as you click on a map icon using the splash feature (open=1).
First or all you have to use a post July the 19th, 2016 github version as Hugh makes it possible !
Then you have to set a field with the right modal syntax that will be displayed in the bubble. For example, if you have a Youtube element to store the video and a title element, you could use a calc element this way :
The "open=1" option is only available in the pro version (not free). It allows to open the modal as soon as you click on a map icon. Without this option, the bubble shows a "watch the video" link that you have to click on.PHP:$video = '{yourlist___your_youtube_element_raw}';
$title = '{yourlist___your_title_element}';
if (strlen($video) > 2) return '{modal https://www.youtube.com/embed/' .$video. '|open=1|title=' .$title. '}watch the video{/modal}';
Finally, add a js script to init the modal feature on Gmap load. Create a file named viz_X.js where X is the id of your Gmap vizualisation entity. This file has to be under components/com_fabrik/js and contains the following :
requirejs(['fab/fabrik'], function() {

   Fabrik.addEvent('fabrik.viz.googlemap.info.opened' ,function(viz, marker){

      initModals();

   });

});
It should work also with some others J! plugins. But the "initModals()" above is very specific to the mentioned plugin.