Showing More than one list in column or bar fusioncharts

p38

Active Member
Hi,

I cannot seem to find any option to display for example 2 lists data in bar2d or column2d side by side in fusion charts?

I only find stacked options.

Also I note if I add a second list, it seems to ADD the data to the first list before displaying

Is there a way to show 2 lists in same fusionchart?

paul
 
Can you point to an example on FC's site of what you are looking for?

I have a feeling at the moment we may not support what you are trying to do, but I may be misunderstanding your requirement. Which I think is for what FC refer to as Multi Series bar / column.

-- hugh
 
http://www.fusioncharts.com/demos/gallery/#column-and-bar

It is the multiseries 3D column chart.

Fabrik allows you to add more than one element to the chart, so my understanding is adding an additional series to the chart as per standard practice.

However, adding an additional series to Fabrik seems to sum all the values, or similar, so I am not sure how this works?

I want to be able to show elements side by side as per FC multiseries column

Paul
 
Yeah, I've had the FusionChart code out on the slab in the lab, and I don't think our MultiSeries handling is going to work the way you want it to.

The issue is, we don't currently have a way for you to tell us what you want the series grouped by. So for instance, if you are charting Pie Sales, of pecan, apple and pumpkin pies, and you've added a dataset for each pie type ... but what you really want is to chart sales of each pie type, grouped by Country ... we aren't set up to do that.

I *may* be able to fix things so if it's an MS series chart, we'll check to see what the underlying list is grouped by, and use that to build the multiple series datasets.

I'll have a go at this, but ... we've been seriously considering just rewriting the whole thing, using an open source JS graphing library. I forget which one Rob likes the look of, but I know he's done some work with it.

So ... if it looks like something I can hack in to the existing fusioncharts plugin without too much trouble, I'll do it. If not, I'd rather put the effort into a rewrite in 3.1.

-- hugh
 
BTW, would that work for you? Even if you didn't group your main list, you could make a copy and group by whatever it is you need to group the multi-series sets by, and base you viz on that copy.

I'm looking at the code, and I seem to recall this is what I had in mind when I started to implement that MS stuff. But I only did the MS stuff for one or two specific clients, in order to get a specific chart type working, and without really using the actual "multi series" part of it.

-- hugh
 
Of course, this would assume that each of your datasets is on the same table, where each dataset simply refers to a different element in that table.

-- hugh
 
Well the problem isn't the group'ing itself, it's that currently the viz code doesn't take account of grouping. And there are also several ways one might expect the data to be presented.

I guess what I need to know is which way round you are expecting this to work.

Taking the example I gave above, of graphing type of pie, by country. So say you have 5 countries, and 3 types of pie. And you want a multe series bar chart, with 5 groups, one for each country, where each group has 3 columns, one for each pie.

The way I would expect the data to to be represented would be a single table:

pies_sold, pie_type, country, date

The date might be optional, i.e. the table might be just one row per country per pie type with total sales, or it might be one row per day's sales per country per pie type.

Then you'd have 3 datasets, all on the same table, same 'Element' of pies_sold, with a "Where" of "pie_type='foo'", a label of 'pie_type', and to have the table group'ed by 'country'.

However, there are several other ways one might expect to be able to do this, using multiple tables ... either pie type specific tables, or country specific tables. Or a 'view' built table, with just one line per country, and a column for each pie type. Etc etc.

So ... which data format would you find the most logical for representing multi series data?

-- hugh
 
I agree, your example with 1 table having all elements and all data is the most convenient way.

To me, the most logical and intuitive representation would be to have the "group_by" element displayed as different data sets (and colors) in the legend.

So in my attached example, it would be "cereal_type" and is displayed in the legend.

In your example it would be "country" that would be displayed in the legend.

So I consider the "group_by" element as being the dataset to display in legend.

The advantage of putting all data into 1 table as you suggested, is I can easily switch the graph around by simply changing the group_by element to
"pie_type", and then I will have the 3 pies repesented on the legend, with the countries plotted as bars.

I would like to go one step further to suggest that the supplied dataset is plotted as is, and no further summation is done on the datasets. So the user must supply a completed dataset if he wants to plot correctly. THis then saves you having to run sub queries to add up columns.

To Summarize : In my example attached, the "group_by" would be "Cereal_type", ie: Rice, wheat, grain.

Paul.
 

Attachments

  • bar3d.JPG
    bar3d.JPG
    25.7 KB · Views: 551
Hmmmm. I'm not sure the "as-is" approach would work, as then we wouldn't know what to do with a table with multiple rows for (say) apple pie sales in Germany.

I think the existing approach, where we do the summing, works for either pre-summed or non-summed data. So if you provide a View with pre-summed data (one row per pie type and country), as far as we're concerned, we're still summing that group, there just happens to be only one row to sum.

OK ... I'll take another look at the code, and see whether I think I can splice this in without too much coding hell.

FYI, the charting solution Rob seems to like is NVD3, //http://nvd3.org/, and he already has the beginnings of a new viz for this in the 3.0 github.

My only concern with NVD3 is that so far it doesn't seem to have much take-up, and I don't see that much activity in the github. So I'm concerned that we may end up painting ourselves into a corner again, where we end up with a solution based on a project which dies off in a year or two.

It also doesn't seem to support Multi Series charts, although I may be wrong.

-- hugh
 
Right, but "grouped" isn't the same as "multi series". Their "grouped" bar charts are still only plotting one dataset. So one dataset, made up of stream0, stream1 and stream1 in this example:

http://nvd3.org/ghpages/multiBar.html

What I *think* you are asking for is for the same element to be graphed in multiple datasets, one dataset per country. So in the above example, one dataset for the 3 streamX from Germany, one set for England, etc.

Or am I misunderstanding your requirements?

-- hugh
 
OK, looks like I was wrong.

So, the remaining question is, whether I spend time hacking a bit on the existing FusionCharts stuff to get MS Bar working, group'ed by a specific element value ... or whether I put that effort into starting serious work on the fledgling NVD3 based plugin.

-- hugh
 
Here is a perfect example of grouped bar charts, using nvd3.

http://bl.ocks.org/mbostock/3887051

It gives you source, plus the csv dataset used to generate the graph.

Note, this example uses one dataset, but the idea would be also to use multiple datasets.

Perhaps you could give me the reasons why you are keen to redo the charts in this new chart tool?

I am all for one not wasting time, so I would be happy to wait for the new plugin if it means an improvement.

Lastly, perhaps I can give you a tip that might help advanced config of this chart........

Would it not be better for you to expose the javascript chart configuration portion to the user, instead of trying to allow for 100's of properties to configure the chart, as in fusioncharts?

In other words, it is up to the user to provide the javascript to configure the chart, with support of placeholders.
 
Well, if you'd seen the FusionCharts plugin code, you'd understand why we want to start again. It started life as a quick and dirty way of building strings to hand to the Google chart API, for a few simple chart types. Then one of our users (a big FusionCharts fan) took that, and as as a first attempt at Fabrik plugin, built the first cut of the fusioncharts plugin. Since then, it's been hacked on by a few more people, including myself, usually when we have a specific need to make it "do something else". The code is ... horrible. I've spent hundreds of hours inside it, and I still understand how / why it does a lot of what it does, LOL!

And yes, we probably would allow direct input of native options, with NVD3.

But the problem is really more basic than that, involving the basic method for letting people actually structure their datasets. The UI mechanics of telling us what data you want from which tables, and how your want it "summed" and "grouped", and how that data is represented in the tables.

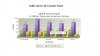
Take for instance the data in the example you pointed at:

http://bl.ocks.org/mbostock/3887051

If you look at the data, it is neatly presented with separate colums for the age groups. But in Fabrik usage, it is very unlikely you would have data formatted like that. You would be more likely to have ...

state,value,age_group
al,1234,1
tx,2345,2
ca,2354,1

... etc. In other words, a single value field, and an "age_group" field which would probably be a join to an "Age Group" lookup table, or a dropdown element. And it would be very unlikely to be a simple "one row per state", it would most likely be multiple rows per state.

In order to get the neatly "separated by age group, one row per state" data, you would probably have to create a MySQL view of your data table, which does all the summing and splits it out into pre-calculated elements. Which in and of itself might not be trivial, and requires creating your view by hand, no GUI help from us.

You said in a previous message:

I would like to go one step further to suggest that the supplied dataset is plotted as is, and no further summation is done on the datasets. So the user must supply a completed dataset if he wants to plot correctly.

Which is obviously what I'm talking about above. But of course that means the user having enough experience / knowledge to build a neatly summed and rowed view for us to operate on. Which doesn't exactly describe out average user. In the above example, splitting out per-age group sums into different fields would be quite a long and involved query.

What I suggest is that we come up with some example data, in a couple of formats that are the most likely formats Fabrik users would tend to want to graph.

My standard test data is "Pie Sales". I have a list of pie sales, by pie type, looking something like:

id, pie_type_id, quantity, date

... (plus other fieds, for customer, PayPal IPN details, etc), with pie_type being a join to pie_types, which looks like:

id, pie_name, pie_price

In other words, a basic pie sales system. I have a Buy Pie form, with a PayPal plugin, which records into pie_sales. And I've built a variety of graphs, based either on my raw Fabrik tables, or views, which chart that data in a variety of way.

We don't have to use this, but I'd suggest we come up with a couple or three typical scenarios for Fabrik usage which people would want to graph. And that we (whoever is interested in working on the new stuff) all set up those examples, and use those to work out the most common charting requirements, and the UI needed to support them.

-- hugh
 
I think there would need to be a fair understanding of the d3 library that nv3d is based on.

My understanding so far is that is has a load of options for grouping / sorting data that might make it possible for us to load any 'flat' source of data and then group it on the client side.
I got that idea from this blog post:
http://www.jeromecukier.net/blog/2012/05/28/manipulating-data-like-a-boss-with-d3/ :

Code:
var data=d3.nest()
  .key(function(d) {return d.continent;})
  .sortKeys(d3.ascending)
  .entries(csv);

so possibly we'd be able to build a simple(ish) interface for setting the nested properties, and potentially allowing the front end user to interact with those settings
 
We are in need of some funding.
More details.

Thank you.

Members online

Back
Top