I've been experiencing very slow loading times when loading my google map visualization of around 400 records. I think it is getting stuck on some sort of query. I've done some troubleshooting, but can't figure much out. Hoping someone here know more than I do when troubleshooting this kind of stuff.
Here is my output from the debug tools of Google Chrome:

As you can see, it takes 9.5 seconds before the browser sees the first byte of data. Wayyy too long.
When viewing the log of mysql, it seems to get stuck during this process:
This only seems to happen during the loading of the Google map visualization. The list view has no issues with time.
Last, but not least, here is my Joomla Debug:
Time: 0.0 ms / 0.0 ms Memory: 0.383 MB / 0.38 MB Application: afterLoad
Time: 22.8 ms / 22.8 ms Memory: 2.105 MB / 2.49 MB Application: afterInitialise
Time: 87.0 ms / 109.8 ms Memory: 0.239 MB / 2.73 MB Application: afterRoute
Time: 27.2 ms / 137.0 ms Memory: 1.119 MB / 3.85 MB Application: start get Request data
.
.
.
Time: 0.6 ms / 203.3 ms Memory: 0.006 MB / 9.48 MB Application: runPlugins: start: onCanEdit
Time: 0.0 ms / 203.3 ms Memory: 0.003 MB / 9.48 MB Application: runPlugins: end: onCanEdit
The last 2 lines repeat about 1000 times. Then I get this:
Time: 0.6 ms / 2914.9 ms Memory: 0.000 MB / 18.00 MB Application: elements renderListData: (380) tableid = 1 hibre_places___TypeOfRelationship
Time: 238.3 ms / 3153.2 ms Memory: 0.035 MB / 18.04 MB Application: elements renderListData: (380) tableid = 1 hibre_places___map_marker
Time: 355.8 ms / 3509.0 ms Memory: 0.044 MB / 18.08 MB Application: elements renderListData: (380) tableid = 1 hibre_places___Active_Business
Time: 171.4 ms / 3680.4 ms Memory: 0.004 MB / 18.08 MB Application: elements renderListData: (380) tableid = 1 hibre_places___Job_Types_Offered
Time: 291.3 ms / 3971.7 ms Memory: 0.035 MB / 18.12 MB Application: elements renderListData: (380) tableid = 1 hibre_places___Last_Contact
Time: 213.4 ms / 4185.1 ms Memory: 0.029 MB / 18.15 MB Application: elements renderListData: (380) tableid = 1 hibre_places___Address
Time: 351.0 ms / 4536.0 ms Memory: 0.008 MB / 18.15 MB Application: elements renderListData: (380) tableid = 1 hibre_places___Location
Then "onCanEdit" repeats about another 1000 times. Then this:
Time: 0.6 ms / 5139.9 ms Memory: 0.000 MB / 21.18 MB Application: elements renderListData: (380) tableid = 1 hibre_places___Primary_Number_Email
Time: 371.5 ms / 5511.4 ms Memory: 0.003 MB / 21.18 MB Application: elements renderListData: (380) tableid = 1 hibre_places___Primary_Contact
Time: 345.1 ms / 5856.5 ms Memory: 0.003 MB / 21.19 MB Application: elements renderListData: (380) tableid = 1 hibre_places___Staff_Contact
Time: 335.4 ms / 6191.9 ms Memory: 0.004 MB / 21.19 MB Application: elements renderListData: (380) tableid = 1 hibre_places___individuals_connected
Time: 355.1 ms / 6547.0 ms Memory: 0.002 MB / 21.19 MB Application: elements renderListData: (380) tableid = 1 hibre_places___Additional_Information
Time: 360.2 ms / 6907.2 ms Memory: 0.007 MB / 21.20 MB Application: elements rendered for table data
Time: 0.4 ms / 6907.6 ms Memory: 0.002 MB / 21.20 MB Application: table grouped-by applied
That's as much debugging as I've done. Any help is greatly appreciated! If you need any more information, please let me know.
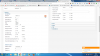
Here is my output from the debug tools of Google Chrome:
As you can see, it takes 9.5 seconds before the browser sees the first byte of data. Wayyy too long.
When viewing the log of mysql, it seems to get stuck during this process:
FROM `hibre_places`
90 QuerySELECT FOUND_ROWS()
*Extremely Long Wait Time*
160303 15:23:29 88 QuerySELECT id, label, db_table_name
FROM hibre_fabrik_lists
88 QuerySELECT l.db_table_name,
el.name, el.plugin, l.label AS listlabel, l.id as list_id,
el.id AS element_id, el.label AS element_label, f.id AS form_id,
el.params AS element_params
This only seems to happen during the loading of the Google map visualization. The list view has no issues with time.
Last, but not least, here is my Joomla Debug:
Time: 0.0 ms / 0.0 ms Memory: 0.383 MB / 0.38 MB Application: afterLoad
Time: 22.8 ms / 22.8 ms Memory: 2.105 MB / 2.49 MB Application: afterInitialise
Time: 87.0 ms / 109.8 ms Memory: 0.239 MB / 2.73 MB Application: afterRoute
Time: 27.2 ms / 137.0 ms Memory: 1.119 MB / 3.85 MB Application: start get Request data
.
.
.
Time: 0.6 ms / 203.3 ms Memory: 0.006 MB / 9.48 MB Application: runPlugins: start: onCanEdit
Time: 0.0 ms / 203.3 ms Memory: 0.003 MB / 9.48 MB Application: runPlugins: end: onCanEdit
The last 2 lines repeat about 1000 times. Then I get this:
Time: 0.6 ms / 2914.9 ms Memory: 0.000 MB / 18.00 MB Application: elements renderListData: (380) tableid = 1 hibre_places___TypeOfRelationship
Time: 238.3 ms / 3153.2 ms Memory: 0.035 MB / 18.04 MB Application: elements renderListData: (380) tableid = 1 hibre_places___map_marker
Time: 355.8 ms / 3509.0 ms Memory: 0.044 MB / 18.08 MB Application: elements renderListData: (380) tableid = 1 hibre_places___Active_Business
Time: 171.4 ms / 3680.4 ms Memory: 0.004 MB / 18.08 MB Application: elements renderListData: (380) tableid = 1 hibre_places___Job_Types_Offered
Time: 291.3 ms / 3971.7 ms Memory: 0.035 MB / 18.12 MB Application: elements renderListData: (380) tableid = 1 hibre_places___Last_Contact
Time: 213.4 ms / 4185.1 ms Memory: 0.029 MB / 18.15 MB Application: elements renderListData: (380) tableid = 1 hibre_places___Address
Time: 351.0 ms / 4536.0 ms Memory: 0.008 MB / 18.15 MB Application: elements renderListData: (380) tableid = 1 hibre_places___Location
Then "onCanEdit" repeats about another 1000 times. Then this:
Time: 0.6 ms / 5139.9 ms Memory: 0.000 MB / 21.18 MB Application: elements renderListData: (380) tableid = 1 hibre_places___Primary_Number_Email
Time: 371.5 ms / 5511.4 ms Memory: 0.003 MB / 21.18 MB Application: elements renderListData: (380) tableid = 1 hibre_places___Primary_Contact
Time: 345.1 ms / 5856.5 ms Memory: 0.003 MB / 21.19 MB Application: elements renderListData: (380) tableid = 1 hibre_places___Staff_Contact
Time: 335.4 ms / 6191.9 ms Memory: 0.004 MB / 21.19 MB Application: elements renderListData: (380) tableid = 1 hibre_places___individuals_connected
Time: 355.1 ms / 6547.0 ms Memory: 0.002 MB / 21.19 MB Application: elements renderListData: (380) tableid = 1 hibre_places___Additional_Information
Time: 360.2 ms / 6907.2 ms Memory: 0.007 MB / 21.20 MB Application: elements rendered for table data
Time: 0.4 ms / 6907.6 ms Memory: 0.002 MB / 21.20 MB Application: table grouped-by applied
That's as much debugging as I've done. Any help is greatly appreciated! If you need any more information, please let me know.